
Washington America The Beautiful ‘ATB’ Quarters
(2010 - 2021)
The America the Beautiful Quarters program began in 2010 as a follow-up to the State and Territories series. Each year, five new designs were released honoring national parks, historic sites, and natural landmarks across the United States and its territories. The obverse continues to feature the portrait of George Washington, using a restored version of the original 1932 design.
Circulating examples were struck in copper-nickel clad composition. Collector versions were also produced in 90% silver proof format. In addition, the U.S. Mint issued special 5-ounce .999 fine silver bullion and collector versions of each design, making this program unique among quarter series.
With 56 designs issued from 2010 through 2021, the America the Beautiful series offers a modern, location-focused collecting theme while maintaining continuity with the long-running Washington quarter tradition.

Check out dates & mintages for Washington America The Beautiful ‘ATB’ Quarters, below.Business Strikes
Type 1, Standard Circulation
2010-P Hot Springs | 34,000,000
2010-D Hot Springs | 34,000,000
2010-P Yellowstone | 33,600,000
2010-D Yellowstone | 33,600,000
2010-P Yosemite | 34,000,000
2010-D Yosemite | 34,000,000
2010-P Grand Canyon | 34,800,000
2010-D Grand Canyon | 34,800,000
2010-P Mount Hood | 34,400,000
2010-D Mount Hood | 34,400,000
2011-P Gettysburg | 30,400,000
2011-D Gettysburg | 30,400,000
2011-P Glacier | 30,400,000
2011-D Glacier | 30,400,000
2011-P Olympic | 30,600,000
2011-D Olympic | 30,600,000
2011-P Vicksburg | 30,800,000
2011-D Vicksburg | 30,800,000
2011-P Chickasaw | 30,600,000
2011-D Chickasaw | 30,600,000
2012-P El Yunque | 25,000,000
2012-D El Yunque | 25,000,000
2012-P Chaco Culture | 22,000,000
2012-D Chaco Culture | 22,000,000
2012-P Acadia | 21,600,000
2012-D Acadia | 21,600,000
2012-P Hawaii Volcanoes | 22,000,000
2012-D Hawaii Volcanoes | 22,000,000
2012-P Denali | 21,200,000
2012-D Denali | 21,200,000
2013-P White Mountain | 30,800,000
2013-D White Mountain | 30,800,000
2013-P Perry’s Victory | 30,600,000
2013-D Perry’s Victory | 30,600,000
2013-P Great Basin | 30,600,000
2013-D Great Basin | 30,600,000
2013-P Fort McHenry | 30,600,000
2013-D Fort McHenry | 30,600,000
2013-P Mount Rushmore | 30,600,000
2013-D Mount Rushmore | 30,600,000
2014-P Great Smoky Mountains | 35,600,000
2014-D Great Smoky Mountains | 35,600,000
2014-P Shenandoah | 35,600,000
2014-D Shenandoah | 35,600,000
2014-P Arches | 22,000,000
2014-D Arches | 22,000,000
2014-P Great Sand Dunes | 21,600,000
2014-D Great Sand Dunes | 21,600,000
2014-P Everglades | 21,600,000
2014-D Everglades | 21,600,000
2015-P Homestead | 35,600,000
2015-D Homestead | 35,600,000
2015-P Kisatchie | 30,600,000
2015-D Kisatchie | 30,600,000
2015-P Blue Ridge Parkway | 30,600,000
2015-D Blue Ridge Parkway | 30,600,000
2015-P Bombay Hook | 30,600,000
2015-D Bombay Hook | 30,600,000
2015-P Saratoga | 30,600,000
2015-D Saratoga | 30,600,000
2016-P Shawnee | 37,800,000
2016-D Shawnee | 37,800,000
2016-P Cumberland Gap | 38,600,000
2016-D Cumberland Gap | 38,600,000
2016-P Harpers Ferry | 35,800,000
2016-D Harpers Ferry | 35,800,000
2016-P Theodore Roosevelt | 35,800,000
2016-D Theodore Roosevelt | 35,800,000
2016-P Fort Moultrie | 35,800,000
2016-D Fort Moultrie | 35,800,000
2017-P Effigy Mounds | 37,800,000
2017-D Effigy Mounds | 37,800,000
2017-P Frederick Douglass | 36,600,000
2017-D Frederick Douglass | 36,600,000
2017-P Ozark Riverways | 35,800,000
2017-D Ozark Riverways | 35,800,000
2017-P Ellis Island | 36,600,000
2017-D Ellis Island | 36,600,000
2017-P George Rogers Clark | 36,600,000
2017-D George Rogers Clark | 36,600,000
2018-P Pictured Rocks | 33,600,000
2018-D Pictured Rocks | 33,600,000
2018-P Apostle Islands | 30,600,000
2018-D Apostle Islands | 30,600,000
2018-P Voyageurs | 30,600,000
2018-D Voyageurs | 30,600,000
2018-P Cumberland Island | 30,600,000
2018-D Cumberland Island | 30,600,000
2018-P Block Island | 30,600,000
2018-D Block Island | 30,600,000
2019-P Lowell | 86,000,000
2019-D Lowell | 86,000,000
2019-P American Memorial Park | 84,200,000
2019-D American Memorial Park | 84,200,000
2019-P War in the Pacific | 72,800,000
2019-D War in the Pacific | 72,800,000
2019-P San Antonio Missions | 142,800,000
2019-D San Antonio Missions | 142,800,000
2019-P Frank Church River of No Return | 125,600,000
2019-D Frank Church River of No Return | 125,600,000
2020-P National Park of American Samoa | 212,200,000
2020-D National Park of American Samoa | 212,200,000
2020-P Weir Farm | 212,200,000
2020-D Weir Farm | 212,200,000
2020-P Salt River Bay | 212,200,000
2020-D Salt River Bay | 212,200,000
2020-P Marsh-Billings-Rockefeller | 212,200,000
2020-D Marsh-Billings-Rockefeller | 212,200,000
2020-P Tallgrass Prairie | 212,200,000
2020-D Tallgrass Prairie | 212,200,000
2021-P Tuskegee Airmen | 206,400,000
2021-D Tuskegee Airmen | 206,400,000
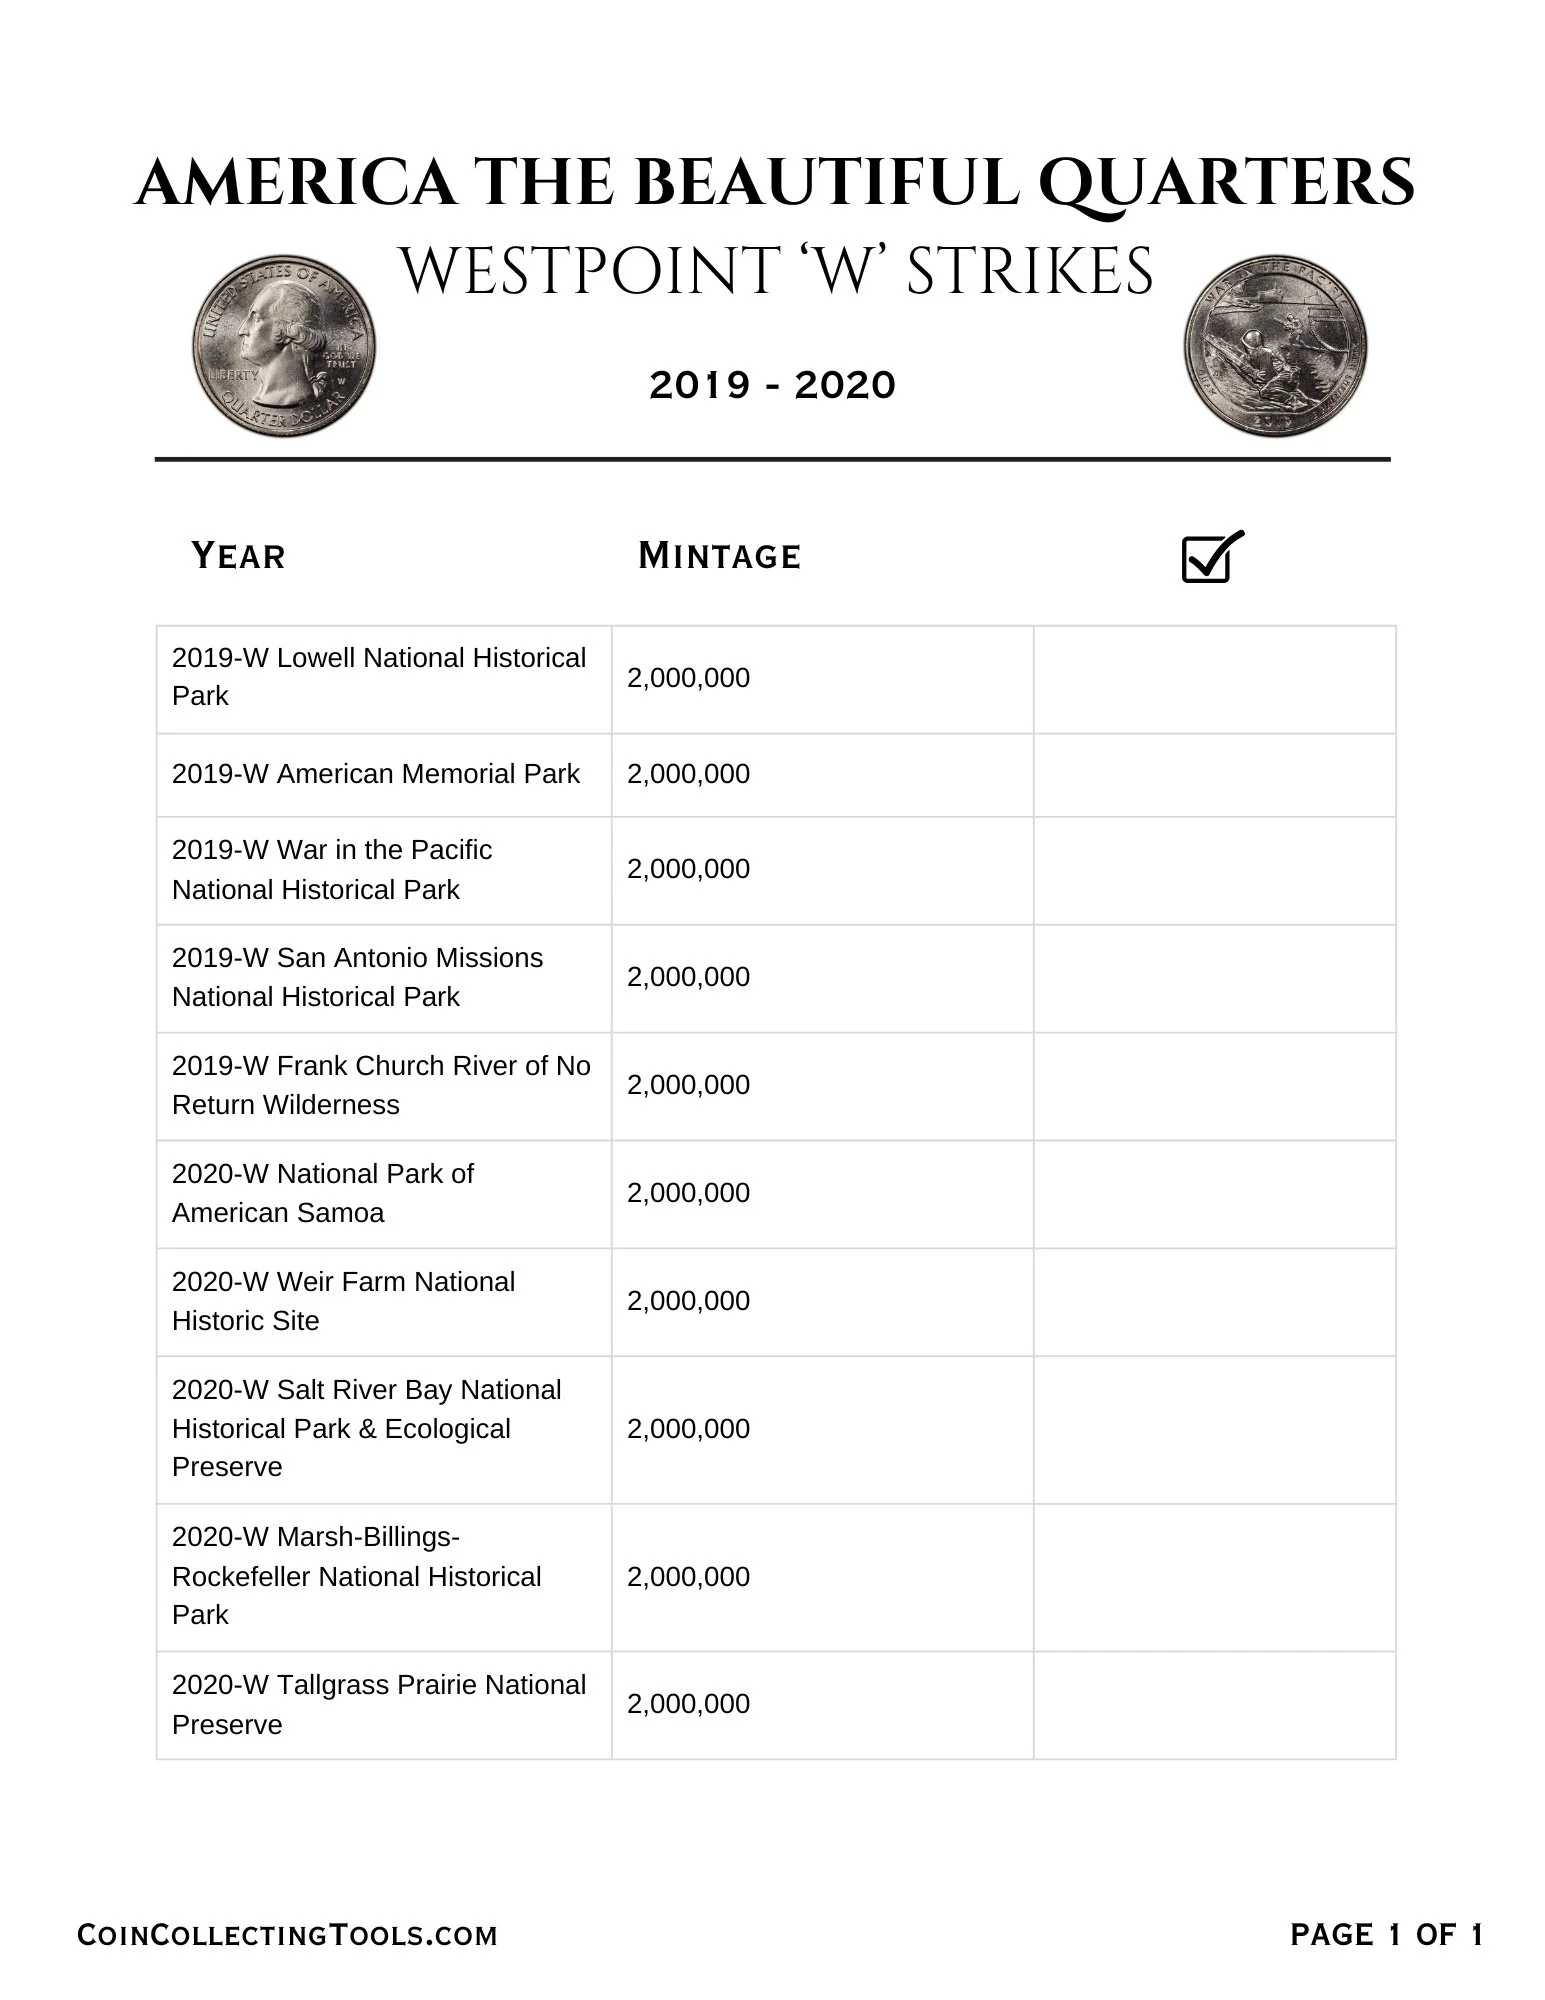
Type 2, WestPoint ‘W’ Strikes
2019-W Lowell National Historical Park | 2,000,000
2019-W American Memorial Park | 2,000,000
2019-W War in the Pacific National Historical Park | 2,000,000
2019-W San Antonio Missions National Historical Park | 2,000,000
2019-W Frank Church River of No Return Wilderness | 2,000,000
2020-W National Park of American Samoa | 2,000,000
2020-W Weir Farm National Historic Site | 2,000,000
2020-W Salt River Bay National Historical Park & Ecological Preserve | 2,000,000
2020-W Marsh-Billings-Rockefeller National Historical Park | 2,000,000
2020-W Tallgrass Prairie National Preserve | 2,000,000
Type 3, Washington Crossing The Delaware
2021-P | NA
2021-D | NA
Proof Strikes
Type 1, Clad
2010-S Hot Springs (Clad Proof) | 1,401,903
2010-S Yellowstone (Clad Proof) | 1,402,756
2010-S Yosemite (Clad Proof) | 1,400,215
2010-S Grand Canyon (Clad Proof) | 1,399,970
2010-S Mount Hood (Clad Proof) | 1,397,101
2011-S Gettysburg (Clad Proof) | 1,273,068
2011-S Glacier (Clad Proof) | 1,269,422
2011-S Olympic (Clad Proof) | 1,268,231
2011-S Vicksburg (Clad Proof) | 1,268,623
2011-S Chickasaw (Clad Proof) | 1,266,825
2012-S El Yunque (Clad Proof) | 1,012,094
2012-S Chaco Culture (Clad Proof) | 961,464
2012-S Acadia (Clad Proof) | 962,038
2012-S Hawaii Volcanoes (Clad Proof) | 962,447
2012-S Denali (Clad Proof) | 959,602
2013-S White Mountain (Clad Proof) | 989,803
2013-S Perry’s Victory (Clad Proof) | 947,815
2013-S Great Basin (Clad Proof) | 945,777
2013-S Fort McHenry (Clad Proof) | 946,380
2013-S Mount Rushmore (Clad Proof) | 958,853
2014-S Great Smoky Mountains (Clad Proof) | 881,896
2014-S Shenandoah (Clad Proof) | 846,441
2014-S Arches (Clad Proof) | 844,775
2014-S Great Sand Dunes (Clad Proof) | 843,238
2014-S Everglades (Clad Proof) | 856,139
2015-S Homestead (Clad Proof) | 831,503
2015-S Kisatchie (Clad Proof) | 762,407
2015-S Blue Ridge Parkway (Clad Proof) | 762,407
2015-S Bombay Hook (Clad Proof) | 762,407
2015-S Saratoga (Clad Proof) | 791,347
2016-S Shawnee (Clad Proof) | 696,564
2016-S Cumberland Gap (Clad Proof) | 666,857
2016-S Harpers Ferry (Clad Proof) | 666,857
2016-S Theodore Roosevelt (Clad Proof) | 666,857
2016-S Fort Moultrie (Clad Proof) | 683,741
2017-S Effigy Mounds (Clad Proof) | 692,129
2017-S Frederick Douglass (Clad Proof) | 657,587
2017-S Ozark Riverways (Clad Proof) | 657,587
2017-S Ellis Island (Clad Proof) | 657,587
2017-S George Rogers Clark (Clad Proof) | 675,757
2018-S Pictured Rocks (Clad Proof) | 653,176
2018-S Apostle Islands (Clad Proof) | 618,988
2018-S Voyageurs (Clad Proof) | 619,013
2018-S Cumberland Island (Clad Proof) | 618,725
2018-S Block Island (Clad Proof) | 636,372
2019-S Lowell (Clad Proof) | 780,732
2019-S American Memorial Park (Clad Proof) | 712,674
2019-S War in the Pacific (Clad Proof) | 712,768
2019-S San Antonio Missions (Clad Proof) | 712,743
2019-S Frank Church (Clad Proof) | 730,874
2020-S National Park of American Samoa (Clad Proof) | 574,037
2020-S Weir Farm National Historic Site (Clad Proof) | 544,660
2020-S Salt River Bay National Historical Park & Ecological Preserve (Clad Proof) | 544,515
2020-S Marsh-Billings-Rockefeller National Historical Park (Clad Proof) | 544,589
2020-S Tallgrass Prairie National Preserve (Clad Proof) | 561,452
2021-S Tuskegee Airmen (Clad Proof) | 490,829
Type 2, Silver
2010-S Hot Springs (Silver Proof) | 859,435
2010-S Yellowstone (Silver Proof) | 859,435
2010-S Yosemite (Silver Proof) | 859,435
2010-S Grand Canyon (Silver Proof) | 859,435
2010-S Mount Hood (Silver Proof) | 859,435
2011-S Gettysburg (Silver Proof) | 722,076
2011-S Glacier (Silver Proof) | 722,076
2011-S Olympic (Silver Proof) | 722,076
2011-S Vicksburg (Silver Proof) | 722,076
2011-S Chickasaw (Silver Proof) | 722,076
2012-S El Yunque (Silver Proof) | 608,060
2012-S Chaco Culture (Silver Proof) | 608,060
2012-S Acadia (Silver Proof) | 608,060
2012-S Hawaii Volcanoes (Silver Proof) | 608,060
2012-S Denali (Silver Proof) | 608,060
2013-S White Mountain (Silver Proof) | 467,691
2013-S Perry’s Victory (Silver Proof) | 467,691
2013-S Great Basin (Silver Proof) | 467,691
2013-S Fort McHenry (Silver Proof) | 467,691
2013-S Mount Rushmore (Silver Proof) | 467,691
2014-S Great Smoky Mountains (Silver Proof) | 472,107
2014-S Shenandoah (Silver Proof) | 472,107
2014-S Arches (Silver Proof) | 472,107
2014-S Great Sand Dunes (Silver Proof) | 472,107
2014-S Everglades (Silver Proof) | 472,107
2015-S Homestead (Silver Proof) | 490,829
2015-S Kisatchie (Silver Proof) | 490,829
2015-S Blue Ridge Parkway (Silver Proof) | 490,829
2015-S Bombay Hook (Silver Proof) | 490,829
2015-S Saratoga (Silver Proof) | 490,829
2016-S Shawnee (Silver Proof) | 502,039
2016-S Cumberland Gap (Silver Proof) | 502,039
2016-S Harpers Ferry (Silver Proof) | 502,039
2016-S Theodore Roosevelt (Silver Proof) | 502,039
2016-S Fort Moultrie (Silver Proof) | 502,039
2017-S Effigy Mounds (Silver Proof) | 496,618
2017-S Frederick Douglass (Silver Proof) | 496,618
2017-S Ozark Riverways (Silver Proof) | 496,618
2017-S Ellis Island (Silver Proof) | 496,618
2017-S George Rogers Clark (Silver Proof) | 496,618
2018-S Pictured Rocks (Silver Proof) | 461,048
2018-S Apostle Islands (Silver Proof) | 461,048
2018-S Voyageurs (Silver Proof) | 461,048
2018-S Cumberland Island (Silver Proof) | 461,048
2018-S Block Island (Silver Proof) | 461,048
2019-S Lowell (Silver Proof) | 539,510
2019-S American Memorial Park (Silver Proof) | 539,510
2019-S War in the Pacific (Silver Proof) | 539,510
2019-S San Antonio Missions (Silver Proof) | 539,510
2019-S Frank Church (Silver Proof) | 539,510
2020-S National Park of American Samoa (Silver Proof) | 427,191
2020-S Weir Farm National Historic Site (Silver Proof) | 427,191
2020-S Salt River Bay National Historical Park & Ecological Preserve (Silver Proof) | 427,191
2020-S Marsh-Billings-Rockefeller National Historical Park (Silver Proof) | 427,191
2020-S Tallgrass Prairie National Preserve (Silver Proof) | 427,191
2021-S Tuskegee Airmen (Silver Proof) | 490,829
Type 3, Washington Crossing The Delaware
2021-S (Clad Proof) | NA
2021-S (Silver Proof) | NA
If You Collect U.S. 25-Cent Coins, Check Out The ‘Washington ATB Quarters, WestPoint Strikes’ Type Set!

Check Out Our Guide to Identifying U.S. Constitutional Silver Coins
Think you might have silver coins in your pocket change? Learn the quick ways to spot United States Coinage made of silver by date, edge color, weight, and more.
Click HERE for the full guide
Why Most State Quarters Aren’t Valuable
The U.S. Mint’s State Quarters program was one of the most popular coin series ever, but despite the hype, most of these coins aren’t worth more than face value. Coin shops regularly see full sets brought in, yet unless they’re silver proofs or graded at the highest levels, dealers simply aren’t buying. Learn why State Quarters are fun to collect but rarely valuable — and what exceptions to look out for.
This site and all of its content was built by collectors for collectors. Join thousands who already trust CoinCollectingTools.com for reliable & accurate information, expert tips, and a connected community on social media. Follow us on YouTube & TikTok @CentsMakeDollars to make sure you never miss a new online resource designed to sharpen your knowledge and collecting strategies.