U.S. 25-Cent Quarters, Continued
Washington Quarter
(1932 - 1999)
The Washington Quarter was first issued in 1932 to commemorate the 200th anniversary of George Washington’s birth. Designed by John Flanagan, the obverse features a left-facing portrait of Washington, while the reverse displays an eagle with outstretched wings.
From 1932 through 1964, Washington Quarters were struck in the traditional 90% silver and 10% copper composition. In 1965, rising silver prices led to a composition change to a copper-nickel clad format (75% copper, 25% nickel bonded to a pure copper core), ending silver production for circulating quarters.
Key dates in the silver portion of the series include the 1932-D and 1932-S. While most clad issues (1965–1998) are common in circulation, higher-grade examples and certain varieties remain collectible. The original eagle reverse design concluded in 1998, before the introduction of the State Quarters program in 1999.

-
1932 | 5,404,000
1932-D | 436,800
1932-S | 408,000
1934 | 31,912,052
1934-D | 3,527,200
1935 | 32,484,000
1935-D | 5,780,000
1935-S | 5,660,000
1936 | 41,300,000
1936-D | 5,374,000
1936-S | 3,828,000
1937 | 19,696,000
1937-D | 7,189,600
1937-S | 1,652,000
1938 | 9,472,000
1938-S | 2,832,000
1939 | 33,540,000
1939-D | 7,092,000
1939-S | 2,628,000
1940 | 35,704,000
1940-D | 2,797,600
1940-S | 8,244,000
1941 | 79,032,000
1941-D | 16,714,800
1941-S | 16,080,000
1942 | 102,096,000
1942-D | 17,487,200
1942-S | 19,384,000
1943 | 99,700,000
1943-D | 16,095,600
1943-S | 21,700,000
1944 | 104,956,000
1944-D | 14,600,800
1944-S | 12,560,000
1945 | 74,372,000
1945-D | 12,341,600
1945-S | 17,004,001
1946 | 53,436,000
1946-D | 9,072,800
1946-S | 4,204,000
1947 | 22,556,000
1947-D | 15,388,000
1947-S | 5,532,000
1948 | 35,196,000
1948-D | 16,766,800
1948-S | 15,960,000
1949 | 9,312,000
1949-D | 10,068,400
1950 | 24,920,126
1950-D | 21,075,600
1950-S | 10,284,004
1951 | 43,448,102
1951-D | 35,354,800
1951-S | 9,048,000
1952 | 38,780,093
1952-D | 49,795,200
1952-S | 13,707,800
1953 | 18,536,120
1953-D | 56,112,400
1953-S | 14,016,000
1954 | 54,412,203
1954-D | 42,305,500
1954-S | 11,834,722
1955 | 18,180,181
1955-D | 3,182,400
1956 | 44,144,000
1956-D | 32,334,500
1957 | 46,532,000
1957-D | 77,924,160
1958 | 6,360,000
1958-D | 78,124,900
1959 | 24,384,000
1959-D | 62,054,232
1960 | 29,164,000
1960-D | 63,000,324
1961 | 37,036,000
1961-D | 83,656,928
1962 | 36,156,000
1962-D | 127,554,756
1963 | 74,316,000
1963-D | 135,288,184
1964 | 560,390,585
1964-D | 704,135,528
-
1936 Proof | 3,837
1937 Proof | 5,542
1938 Proof | 8,045
1939 Proof | 8,795
1940 Proof | 11,246
1941 Proof | 15,287
1942 Proof | 21,123
1950 Proof | 51,386
1951 Proof | 57,500
1952 Proof | 81,980
1953 Proof | 128,800
1954 Proof | 233,300
1955 Proof | 378,200
1956 Proof | 669,384
1957 Proof | 1,247,952
1958 Proof | 875,652
1959 Proof | 1,149,291
1960 Proof | 1,691,602
1961 Proof | 3,028,244
1962 Proof | 3,218,019
1963 Proof | 3,075,645
1964 Proof | 3,950,762
-
1965 | 1,819,717,540
1966 | 821,101,500
1967 | 1,524,031,848
1968 | 220,731,500
1968-D | 101,534,000
1969 | 176,212,000
1969-D | 114,372,000
1970 | 136,420,000
1970-D | 417,341,364
1971 | 109,284,000
1971-D | 258,634,428
1972 | 215,048,000
1972-D | 311,067,732
1973 | 346,924,000
1973-D | 232,977,400
1974 | 801,456,000
1974-D | 353,160,300
1976 Bicentennial | 809,784,016
1976-D Bicentennial | 860,118,839
1976-S Silver Clad Bicentennial | 11,000,000
1977 | 468,556,000
1977-D | 256,524,978
1978 | 521,452,000
1978-D | 287,373,152
1979 | 518,708,000
1979-D | 489,789,780
1980-P | 635,832,000
1980-D | 518,327,487
1981-P | 601,716,000
1981-D | 575,722,833
1982-P | 500,931,000
1982-D | 480,042,788
1983-P | 673,535,000
1983-D | 617,806,446
1984-P | 676,545,000
1984-D | 546,483,064
1985-P | 775,818,962
1985-D | 519,962,888
1986-P | 551,199,333
1986-D | 504,298,660
1987-P | 582,499,481
1987-D | 655,594,696
1988-P | 562,052,000
1988-D | 596,810,688
1989-P | 512,868,000
1989-D | 896,535,597
1990-P | 613,792,000
1990-D | 927,638,181
1991-P | 570,968,000
1991-D | 630,966,693
1992-P | 384,764,000
1992-D | 389,777,107
1993-P | 639,276,000
1993-D | 645,476,128
1994-P | 825,600,000
1994-D | 880,034,110
1995-P | 1,004,336,000
1995-D | 1,103,216,000
1996-P | 925,040,000
1996-D | 906,868,000
1997-P | 595,740,000
1997-D | 599,680,000
1998-P | 896,268,000
1998-D | 821,000,000
-
Type 1, Clad
1968-S Proof | 3,041,506
1969-S Proof | 2,934,631
1970-S Proof | 2,632,810
1971-S Proof | 3,220,733
1972-S Proof | 3,260,996
1973-S Proof | 2,760,339
1974-S Proof | 2,612,568
1976-S Proof | 7,059,099
1977-S Proof | 3,251,152
1978-S Proof | 3,127,781
1979-S Proof | 3,677,175
1980-S Proof | 3,554,806
1981-S Proof | 4,063,083
1982-S Proof | 3,857,479
1983-S Proof | 3,279,126
1984-S Proof | 3,065,110
1985-S Proof | 3,362,821
1986-S Proof | 3,010,497
1987-S Proof | 4,227,728
1988-S Proof | 3,262,948
1989-S Proof | 3,220,194
1990-S Proof | 3,299,559
1991-S Proof | 2,867,787
1992-S Proof | 2,858,981
1993-S Proof | 2,633,439
1994-S Proof | 2,484,594
1995-S Proof | 2,117,496
1996-S Proof | 1,750,244
1997-S Proof | 2,055,000
1998-S Proof | 2,086,507
Type 2, Silver
1976-S Silver Proof | 4,000,000
1992-S Silver Proof | 1,317,579
1993-S Silver Proof | 761,353
1994-S Silver Proof | 785,329
1995-S Silver Proof | 679,985
1996-S Silver Proof | 775,021
1997-S Silver Proof | 741,678
1998-S Silver Proof | 878,792
Washington 50 States & Territories Quarters
(1999 - 2009)
The 50 State Quarters program began in 1999 and ran through 2008, honoring each state in the order they ratified the Constitution. In 2009, the program expanded to include six additional designs representing U.S. territories and the District of Columbia. All coins feature the obverse portrait of George Washington, with updated inscriptions beginning in 1999.
These quarters were struck primarily in a copper-nickel clad composition for circulation. Silver versions (90% silver) were also produced for collectors in proof sets. Each state and territory reverse highlights unique symbols, landmarks, or historical themes, creating 56 distinct designs in total.
The program significantly increased public interest in coin collecting and remains one of the most widely saved modern U.S. coin series. Mintmarks include Philadelphia (P), Denver (D), and San Francisco (S) for proof and silver issues.

-
1999-P Delaware | 373,400,000
1999-D Delaware | 401,424,000
1999-P Pennsylvania | 349,000,000
1999-D Pennsylvania | 358,332,000
1999-P New Jersey | 363,200,000
1999-D New Jersey | 299,028,000
1999-P Georgia | 451,188,000
1999-D Georgia | 488,744,000
1999-P Connecticut | 688,744,000
1999-D Connecticut | 657,880,000
2000-P Massachusetts | 628,600,000
2000-D Massachusetts | 535,184,000
2000-P Maryland | 678,200,000
2000-D Maryland | 556,532,000
2000-P South Carolina | 742,576,000
2000-D South Carolina | 566,208,000
2000-P New Hampshire | 673,040,000
2000-D New Hampshire | 495,976,000
2000-P Virginia | 943,000,000
2000-D Virginia | 651,616,000
2001-P New York | 655,400,000
2001-D New York | 619,640,000
2001-P North Carolina | 627,600,000
2001-D North Carolina | 427,876,000
2001-P Rhode Island | 423,000,000
2001-D Rhode Island | 447,100,000
2001-P Vermont | 423,400,000
2001-D Vermont | 459,404,000
2001-P Kentucky | 353,000,000
2001-D Kentucky | 370,564,000
2002-P Tennessee | 361,600,000
2002-D Tennessee | 286,468,000
2002-P Ohio | 217,200,000
2002-D Ohio | 414,832,000
2002-P Louisiana | 362,000,000
2002-D Louisiana | 402,204,000
2002-P Indiana | 362,600,000
2002-D Indiana | 327,200,000
2002-P Mississippi | 290,000,000
2002-D Mississippi | 289,600,000
2003-P Illinois | 225,800,000
2003-D Illinois | 237,400,000
2003-P Alabama | 225,000,000
2003-D Alabama | 232,400,000
2003-P Maine | 217,400,000
2003-D Maine | 231,400,000
2003-P Missouri | 225,000,000
2003-D Missouri | 228,200,000
2003-P Arkansas | 228,000,000
2003-D Arkansas | 229,800,000
2004-P Michigan | 233,800,000
2004-D Michigan | 225,800,000
2004-P Florida | 240,200,000
2004-D Florida | 241,600,000
2004-P Texas | 278,800,000
2004-D Texas | 263,000,000
2004-P Iowa | 213,800,000
2004-D Iowa | 251,400,000
2004-P Wisconsin | 226,400,000
2004-D Wisconsin | 226,800,000
2005-P California | 257,200,000
2005-P California | 263,200,000
2005-P Minnesota | 239,600,000
2005-D Minnesota | 248,400,000
2005-P Oregon | 316,200,000
2005-D Oregon | 404,000,000
2005-P Kansas | 263,400,000
2005-D Kansas | 300,000,000
2005-P West Virginia | 365,400,000
2005-D West Virginia | 356,200,000
2006-P Nevada | 277,000,000
2006-D Nevada | 312,800,000
2006-P Nebraska | 318,000,000
2006-D Nebraska | 276,400,000
2006-P Colorado | 274,800,000
2006-D Colorado | 294,200,000
2006-P North Dakota | 305,800,000
2006-D North Dakota | 359,000,000
2006-P South Dakota | 245,000,000
2006-D South Dakota | 265,800,000
2007-P Montana | 257,000,000
2007-D Montana | 256,240,000
2007-P Washington | 265,200,000
2007-D Washington | 280,000,000
2007-P Idaho | 294,600,000
2007-D Idaho | 286,800,000
2007-P Wyoming | 243,600,000
2007-D Wyoming | 320,800,000
2007-P Utah | 255,000,000
2007-D Utah | 253,200,000
2008-P Oklahoma | 222,000,000
2008-D Oklahoma | 194,600,000
2008-P New Mexico | 244,200,000
2008-D New Mexico | 244,400,000
2008-P Arizona | 244,600,000
2008-D Arizona | 265,000,000
2008-P Alaska | 251,800,000
2008-D Alaska | 254,000,000
2008-P Hawaii | 254,000,000
2008-D Hawaii | 263,600,000
2009-P District of Columbia | 83,600,000
2009-D District of Columbia | 88,800,000
2009-P Puerto Rico | 53,200,000
2009-D Puerto Rico | 86,000,000
2009-P Guam | 45,000,000
2009-D Guam | 42,600,000
2009-P American Samoa | 42,600,000
2009-D American Samoa | 39,600,000
2009-P U.S. Virgin Islands | 41,000,000
2009-D U.S. Virgin Islands | 41,000,000
2009-P Northern Mariana Islands | 35,200,000
2009-D Northern Mariana Islands | 37,600,000
-
1999-S Delaware | 3,713,359
1999-S Pennsylvania | 3,713,359
1999-S New Jersey | 3,713,359
1999-S Georgia | 3,713,359
1999-S Connecticut | 3,713,359
2000-S Massachusetts | 4,020,172
2000-S Maryland | 4,020,172
2000-S South Carolina | 4,020,172
2000-S New Hampshire | 4,020,172
2000-S Virginia | 4,020,172
2001-S New York | 3,094,140
2001-S North Carolina | 3,094,140
2001-S Rhode Island | 3,094,140
2001-S Vermont | 3,094,140
2001-S Kentucky | 3,094,140
2002-S Tennessee | 3,084,245
2002-S Ohio | 3,084,245
2002-S Louisiana | 3,084,245
2002-S Indiana | 3,084,245
2002-S Mississippi | 3,084,245
2003-S Illinois | 3,408,516
2003-S Alabama | 3,408,516
2003-S Maine | 3,408,516
2003-S Missouri | 3,408,516
2003-S Arkansas | 3,408,516
2004-S Michigan | 2,740,684
2004-S Florida | 2,740,684
2004-S Texas | 2,740,684
2004-S Iowa | 2,740,684
2004-S Wisconsin | 2,740,684
2005-S California | 3,262,960
2005-S Minnesota | 3,262,960
2005-S Oregon | 3,262,960
2005-S Kansas | 3,262,960
2005-S West Virginia | 3,262,960
2006-S Nevada | 2,882,428
2006-S Nebraska | 2,882,428
2006-S Colorado | 2,882,428
2006-S North Dakota | 2,882,428
2006-S South Dakota | 2,882,428
2007-S Montana | 2,374,778
2007-S Washington | 2,374,778
2007-S Idaho | 2,374,778
2007-S Wyoming | 2,374,778
2007-S Utah | 2,374,778
2008-S Oklahoma | 2,078,112
2008-S New Mexico | 2,078,112
2008-S Arizona | 2,078,112
2008-S Alaska | 2,078,112
2008-S Hawaii | 2,078,112
2009-S District of Columbia | 2,113,478
2009-S Puerto Rico | 2,113,478
2009-S Guam | 2,113,478
2009-S American Samoa | 2,113,478
2009-S U.S. Virgin Islands | 2,113,478
2009-S Northern Mariana Islands | 2,113,478
-
1999-S Silver Delaware | 804,565
1999-S Silver Pennsylvania | 804,565
1999-S Silver New Jersey | 804,565
1999-S Silver Georgia | 804,565
1999-S Silver Connecticut | 804,565
2000-S Silver Massachusetts | 965,421
2000-S Silver Maryland | 965,421
2000-S Silver South Carolina | 965,421
2000-S Silver New Hampshire | 965,421
2000-S Silver Virginia | 965,421
2001-S Silver New York | 889,697
2001-S Silver North Carolina | 889,697
2001-S Silver Rhode Island | 889,697
2001-S Silver Vermont | 889,697
2001-S Silver Kentucky | 889,697
2002-S Silver Tennessee | 892,229
2002-S Silver Ohio | 892,229
2002-S Silver Louisiana | 892,229
2002-S Silver Indiana | 892,229
2002-S Silver Mississippi | 892,229
2003-S Silver Illinois | 1,125,755
2003-S Silver Alabama | 1,125,755
2003-S Silver Maine | 1,125,755
2003-S Silver Missouri | 1,125,755
2003-S Silver Arkansas | 1,125,755
2004-S Silver Michigan | 1,769,786
2004-S Silver Florida | 1,769,786
2004-S Silver Texas | 1,769,786
2004-S Silver Iowa | 1,769,786
2004-S Silver Wisconsin | 1,769,786
2005-S Silver California | 1,678,649
2005-S Silver Minnesota | 1,678,649
2005-S Silver Oregon | 1,678,649
2005-S Silver Kansas | 1,678,649
2005-S Silver West Virginia | 1,678,649
2006-S Silver Nevada | 1,585,008
2006-S Silver Nebraska | 1,585,008
2006-S Silver Colorado | 1,585,008
2006-S Silver North Dakota | 1,585,008
2006-S Silver South Dakota | 1,585,008
2007-S Silver Montana | 1,313,481
2007-S Silver Washington | 1,313,481
2007-S Silver Idaho | 1,313,481
2007-S Silver Wyoming | 1,313,481
2007-S Silver Utah | 1,313,481
2008-S Silver Oklahoma | 1,192,908
2008-S Silver New Mexico | 1,192,908
2008-S Silver Arizona | 1,192,908
2008-S Silver Alaska | 1,192,908
2008-S Silver Hawaii | 1,192,908
2009-S Silver District of Columbia | 996,548
2009-S Silver Puerto Rico | 996,548
2009-S Silver Guam | 996,548
2009-S Silver American Samoa | 996,548
2009-S Silver U.S. Virgin Islands | 996,548
2009-S Silver Northern Mariana Islands | 996,548
Washington America The Beautiful Quarters
(2010 - 2021)
The America the Beautiful Quarters program began in 2010 as a follow-up to the State and Territories series. Each year, five new designs were released honoring national parks, historic sites, and natural landmarks across the United States and its territories. The obverse continues to feature the portrait of George Washington, using a restored version of the original 1932 design.
Circulating examples were struck in copper-nickel clad composition. Collector versions were also produced in 90% silver proof format. In addition, the U.S. Mint issued special 5-ounce .999 fine silver bullion and collector versions of each design, making this program unique among quarter series.
With 56 designs issued from 2010 through 2021, the America the Beautiful series offers a modern, location-focused collecting theme while maintaining continuity with the long-running Washington quarter tradition.

-
2010-P Hot Springs | 34,000,000
2010-D Hot Springs | 34,000,000
2010-P Yellowstone | 33,600,000
2010-D Yellowstone | 33,600,000
2010-P Yosemite | 34,000,000
2010-D Yosemite | 34,000,000
2010-P Grand Canyon | 34,800,000
2010-D Grand Canyon | 34,800,000
2010-P Mount Hood | 34,400,000
2010-D Mount Hood | 34,400,000
2011-P Gettysburg | 30,400,000
2011-D Gettysburg | 30,400,000
2011-P Glacier | 30,400,000
2011-D Glacier | 30,400,000
2011-P Olympic | 30,600,000
2011-D Olympic | 30,600,000
2011-P Vicksburg | 30,800,000
2011-D Vicksburg | 30,800,000
2011-P Chickasaw | 30,600,000
2011-D Chickasaw | 30,600,000
2012-P El Yunque | 25,000,000
2012-D El Yunque | 25,000,000
2012-P Chaco Culture | 22,000,000
2012-D Chaco Culture | 22,000,000
2012-P Acadia | 21,600,000
2012-D Acadia | 21,600,000
2012-P Hawaii Volcanoes | 22,000,000
2012-D Hawaii Volcanoes | 22,000,000
2012-P Denali | 21,200,000
2012-D Denali | 21,200,000
2013-P White Mountain | 30,800,000
2013-D White Mountain | 30,800,000
2013-P Perry’s Victory | 30,600,000
2013-D Perry’s Victory | 30,600,000
2013-P Great Basin | 30,600,000
2013-D Great Basin | 30,600,000
2013-P Fort McHenry | 30,600,000
2013-D Fort McHenry | 30,600,000
2013-P Mount Rushmore | 30,600,000
2013-D Mount Rushmore | 30,600,000
2014-P Great Smoky Mountains | 35,600,000
2014-D Great Smoky Mountains | 35,600,000
2014-P Shenandoah | 35,600,000
2014-D Shenandoah | 35,600,000
2014-P Arches | 22,000,000
2014-D Arches | 22,000,000
2014-P Great Sand Dunes | 21,600,000
2014-D Great Sand Dunes | 21,600,000
2014-P Everglades | 21,600,000
2014-D Everglades | 21,600,000
2015-P Homestead | 35,600,000
2015-D Homestead | 35,600,000
2015-P Kisatchie | 30,600,000
2015-D Kisatchie | 30,600,000
2015-P Blue Ridge Parkway | 30,600,000
2015-D Blue Ridge Parkway | 30,600,000
2015-P Bombay Hook | 30,600,000
2015-D Bombay Hook | 30,600,000
2015-P Saratoga | 30,600,000
2015-D Saratoga | 30,600,000
2016-P Shawnee | 37,800,000
2016-D Shawnee | 37,800,000
2016-P Cumberland Gap | 38,600,000
2016-D Cumberland Gap | 38,600,000
2016-P Harpers Ferry | 35,800,000
2016-D Harpers Ferry | 35,800,000
2016-P Theodore Roosevelt | 35,800,000
2016-D Theodore Roosevelt | 35,800,000
2016-P Fort Moultrie | 35,800,000
2016-D Fort Moultrie | 35,800,000
2017-P Effigy Mounds | 37,800,000
2017-D Effigy Mounds | 37,800,000
2017-P Frederick Douglass | 36,600,000
2017-D Frederick Douglass | 36,600,000
2017-P Ozark Riverways | 35,800,000
2017-D Ozark Riverways | 35,800,000
2017-P Ellis Island | 36,600,000
2017-D Ellis Island | 36,600,000
2017-P George Rogers Clark | 36,600,000
2017-D George Rogers Clark | 36,600,000
2018-P Pictured Rocks | 33,600,000
2018-D Pictured Rocks | 33,600,000
2018-P Apostle Islands | 30,600,000
2018-D Apostle Islands | 30,600,000
2018-P Voyageurs | 30,600,000
2018-D Voyageurs | 30,600,000
2018-P Cumberland Island | 30,600,000
2018-D Cumberland Island | 30,600,000
2018-P Block Island | 30,600,000
2018-D Block Island | 30,600,000
2019-P Lowell | 86,000,000
2019-D Lowell | 86,000,000
2019-P American Memorial Park | 84,200,000
2019-D American Memorial Park | 84,200,000
2019-P War in the Pacific | 72,800,000
2019-D War in the Pacific | 72,800,000
2019-P San Antonio Missions | 142,800,000
2019-D San Antonio Missions | 142,800,000
2019-P Frank Church River of No Return | 125,600,000
2019-D Frank Church River of No Return | 125,600,000
2020-P National Park of American Samoa | 212,200,000
2020-D National Park of American Samoa | 212,200,000
2020-P Weir Farm | 212,200,000
2020-D Weir Farm | 212,200,000
2020-P Salt River Bay | 212,200,000
2020-D Salt River Bay | 212,200,000
2020-P Marsh-Billings-Rockefeller | 212,200,000
2020-D Marsh-Billings-Rockefeller | 212,200,000
2020-P Tallgrass Prairie | 212,200,000
2020-D Tallgrass Prairie | 212,200,000
2021-P Tuskegee Airmen | 206,400,000
2021-D Tuskegee Airmen | 206,400,000
-
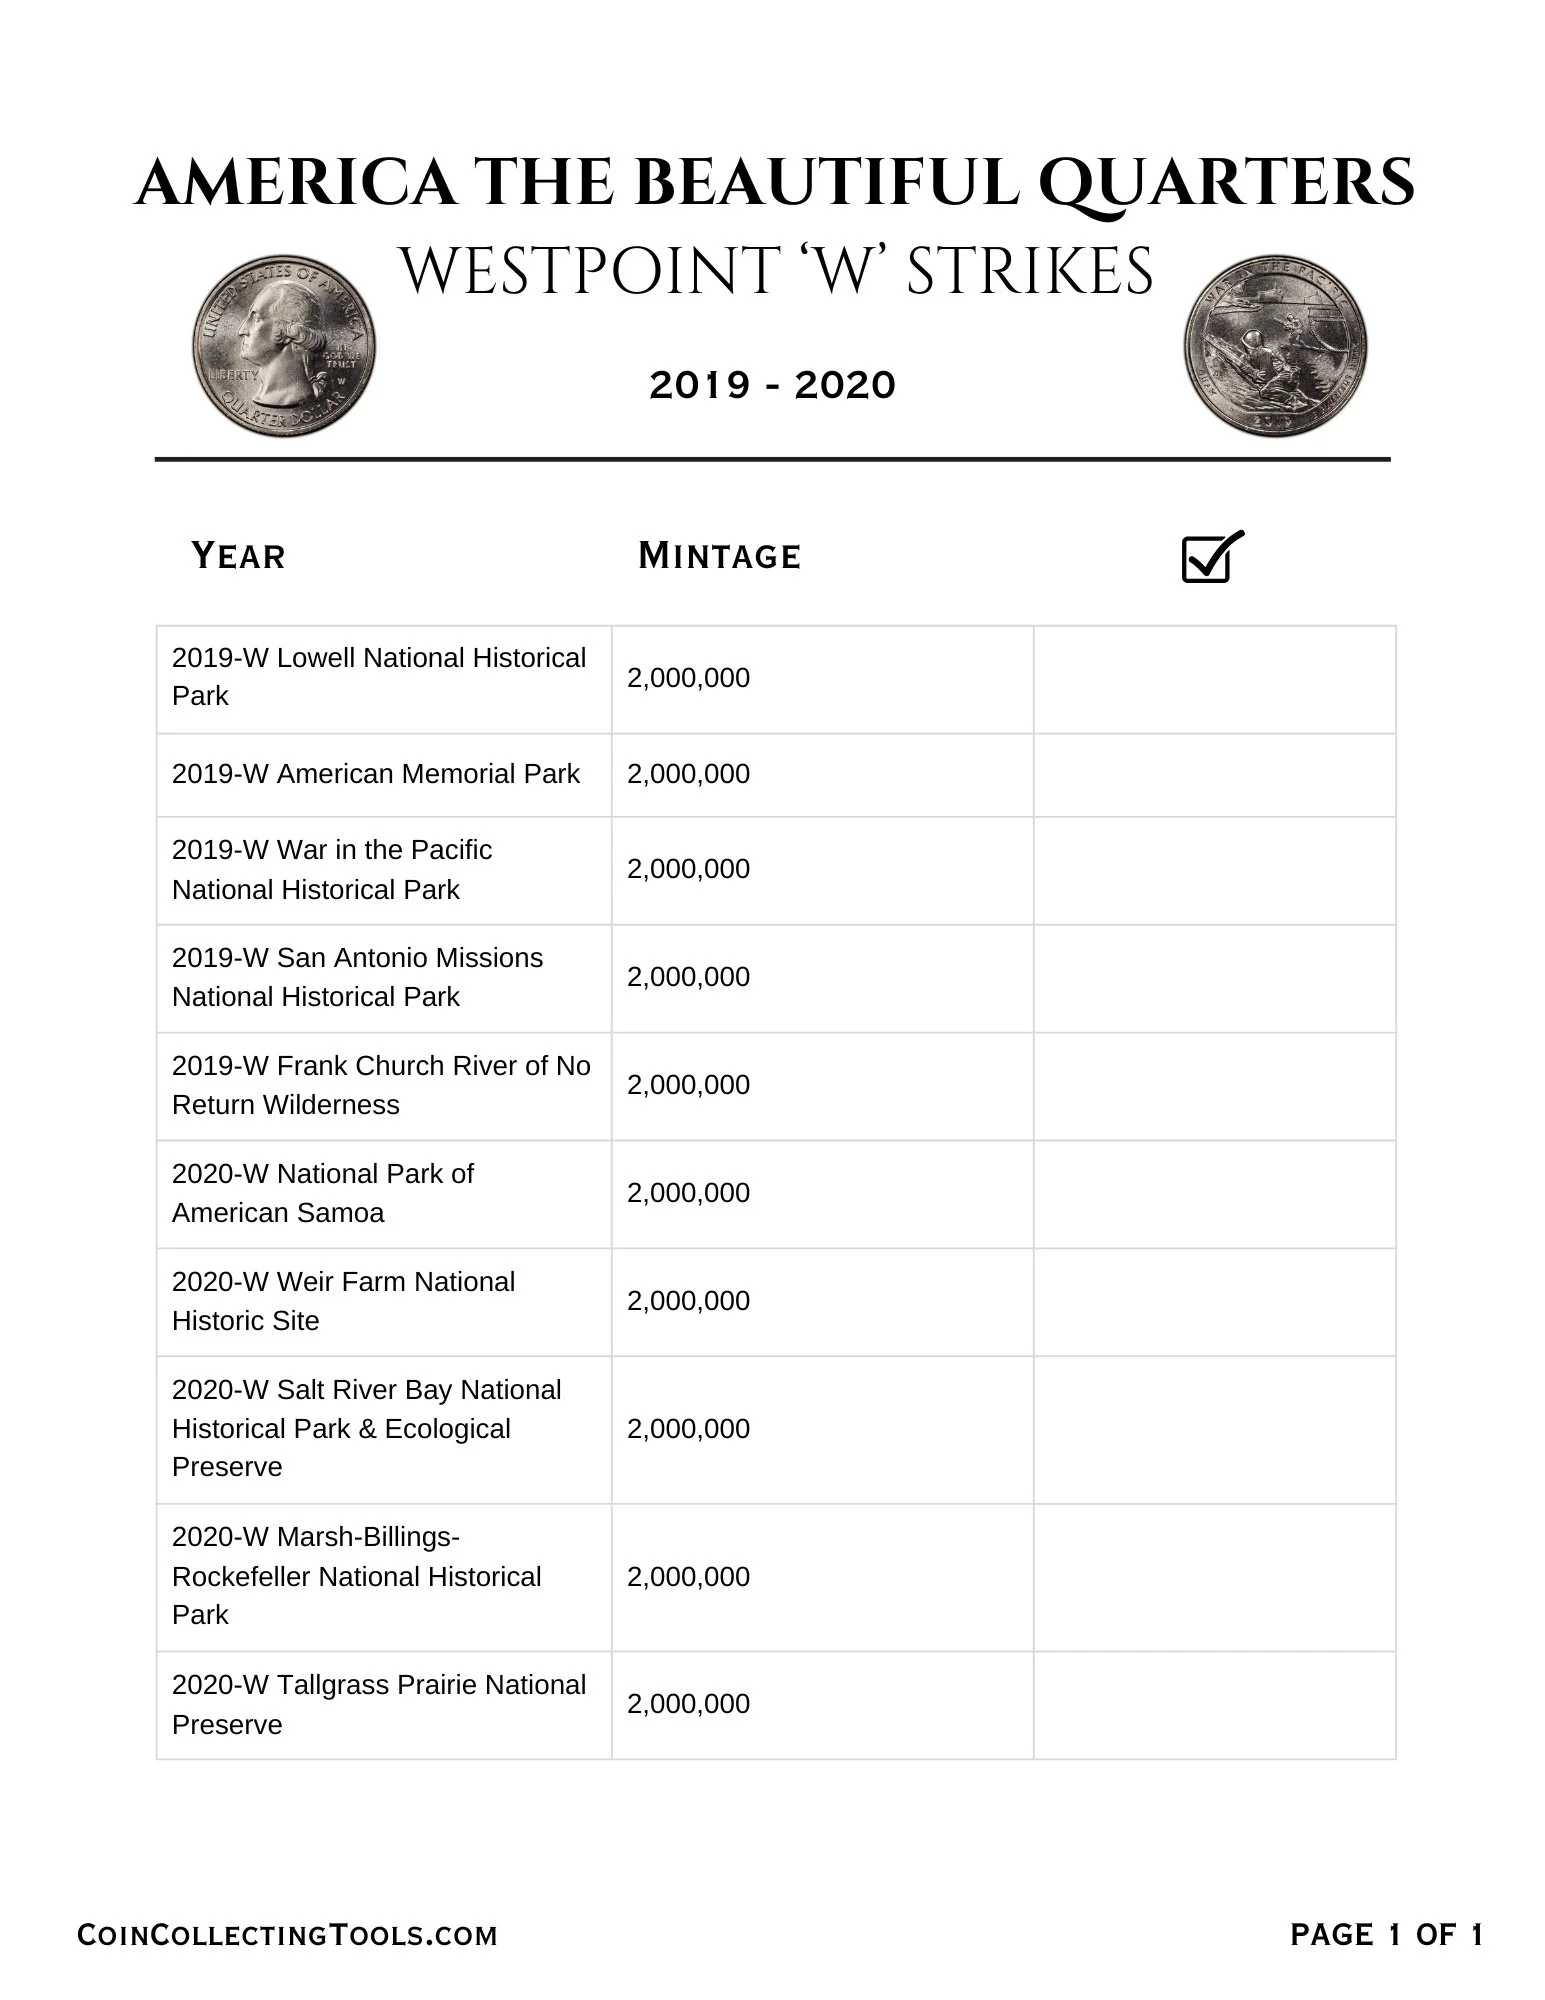
2019-W Lowell National Historical Park | 2,000,000
2019-W American Memorial Park | 2,000,000
2019-W War in the Pacific National Historical Park | 2,000,000
2019-W San Antonio Missions National Historical Park | 2,000,000
2019-W Frank Church River of No Return Wilderness | 2,000,000
2020-W National Park of American Samoa | 2,000,000
2020-W Weir Farm National Historic Site | 2,000,000
2020-W Salt River Bay National Historical Park & Ecological Preserve | 2,000,000
2020-W Marsh-Billings-Rockefeller National Historical Park | 2,000,000
2020-W Tallgrass Prairie National Preserve | 2,000,000
-
2010-S Hot Springs (Clad Proof) | 1,401,903
2010-S Yellowstone (Clad Proof) | 1,402,756
2010-S Yosemite (Clad Proof) | 1,400,215
2010-S Grand Canyon (Clad Proof) | 1,399,970
2010-S Mount Hood (Clad Proof) | 1,397,101
2011-S Gettysburg (Clad Proof) | 1,273,068
2011-S Glacier (Clad Proof) | 1,269,422
2011-S Olympic (Clad Proof) | 1,268,231
2011-S Vicksburg (Clad Proof) | 1,268,623
2011-S Chickasaw (Clad Proof) | 1,266,825
2012-S El Yunque (Clad Proof) | 1,012,094
2012-S Chaco Culture (Clad Proof) | 961,464
2012-S Acadia (Clad Proof) | 962,038
2012-S Hawaii Volcanoes (Clad Proof) | 962,447
2012-S Denali (Clad Proof) | 959,602
2013-S White Mountain (Clad Proof) | 989,803
2013-S Perry’s Victory (Clad Proof) | 947,815
2013-S Great Basin (Clad Proof) | 945,777
2013-S Fort McHenry (Clad Proof) | 946,380
2013-S Mount Rushmore (Clad Proof) | 958,853
2014-S Great Smoky Mountains (Clad Proof) | 881,896
2014-S Shenandoah (Clad Proof) | 846,441
2014-S Arches (Clad Proof) | 844,775
2014-S Great Sand Dunes (Clad Proof) | 843,238
2014-S Everglades (Clad Proof) | 856,139
2015-S Homestead (Clad Proof) | 831,503
2015-S Kisatchie (Clad Proof) | 762,407
2015-S Blue Ridge Parkway (Clad Proof) | 762,407
2015-S Bombay Hook (Clad Proof) | 762,407
2015-S Saratoga (Clad Proof) | 791,347
2016-S Shawnee (Clad Proof) | 696,564
2016-S Cumberland Gap (Clad Proof) | 666,857
2016-S Harpers Ferry (Clad Proof) | 666,857
2016-S Theodore Roosevelt (Clad Proof) | 666,857
2016-S Fort Moultrie (Clad Proof) | 683,741
2017-S Effigy Mounds (Clad Proof) | 692,129
2017-S Frederick Douglass (Clad Proof) | 657,587
2017-S Ozark Riverways (Clad Proof) | 657,587
2017-S Ellis Island (Clad Proof) | 657,587
2017-S George Rogers Clark (Clad Proof) | 675,757
2018-S Pictured Rocks (Clad Proof) | 653,176
2018-S Apostle Islands (Clad Proof) | 618,988
2018-S Voyageurs (Clad Proof) | 619,013
2018-S Cumberland Island (Clad Proof) | 618,725
2018-S Block Island (Clad Proof) | 636,372
2019-S Lowell (Clad Proof) | 780,732
2019-S American Memorial Park (Clad Proof) | 712,674
2019-S War in the Pacific (Clad Proof) | 712,768
2019-S San Antonio Missions (Clad Proof) | 712,743
2019-S Frank Church (Clad Proof) | 730,874
2020-S National Park of American Samoa (Clad Proof) | 574,037
2020-S Weir Farm National Historic Site (Clad Proof) | 544,660
2020-S Salt River Bay National Historical Park & Ecological Preserve (Clad Proof) | 544,515
2020-S Marsh-Billings-Rockefeller National Historical Park (Clad Proof) | 544,589
2020-S Tallgrass Prairie National Preserve (Clad Proof) | 561,452
2021-S Tuskegee Airmen (Clad Proof) | 490,829
-
2010-S Hot Springs (Silver Proof) | 859,435
2010-S Yellowstone (Silver Proof) | 859,435
2010-S Yosemite (Silver Proof) | 859,435
2010-S Grand Canyon (Silver Proof) | 859,435
2010-S Mount Hood (Silver Proof) | 859,435
2011-S Gettysburg (Silver Proof) | 722,076
2011-S Glacier (Silver Proof) | 722,076
2011-S Olympic (Silver Proof) | 722,076
2011-S Vicksburg (Silver Proof) | 722,076
2011-S Chickasaw (Silver Proof) | 722,076
2012-S El Yunque (Silver Proof) | 608,060
2012-S Chaco Culture (Silver Proof) | 608,060
2012-S Acadia (Silver Proof) | 608,060
2012-S Hawaii Volcanoes (Silver Proof) | 608,060
2012-S Denali (Silver Proof) | 608,060
2013-S White Mountain (Silver Proof) | 467,691
2013-S Perry’s Victory (Silver Proof) | 467,691
2013-S Great Basin (Silver Proof) | 467,691
2013-S Fort McHenry (Silver Proof) | 467,691
2013-S Mount Rushmore (Silver Proof) | 467,691
2014-S Great Smoky Mountains (Silver Proof) | 472,107
2014-S Shenandoah (Silver Proof) | 472,107
2014-S Arches (Silver Proof) | 472,107
2014-S Great Sand Dunes (Silver Proof) | 472,107
2014-S Everglades (Silver Proof) | 472,107
2015-S Homestead (Silver Proof) | 490,829
2015-S Kisatchie (Silver Proof) | 490,829
2015-S Blue Ridge Parkway (Silver Proof) | 490,829
2015-S Bombay Hook (Silver Proof) | 490,829
2015-S Saratoga (Silver Proof) | 490,829
2016-S Shawnee (Silver Proof) | 502,039
2016-S Cumberland Gap (Silver Proof) | 502,039
2016-S Harpers Ferry (Silver Proof) | 502,039
2016-S Theodore Roosevelt (Silver Proof) | 502,039
2016-S Fort Moultrie (Silver Proof) | 502,039
2017-S Effigy Mounds (Silver Proof) | 496,618
2017-S Frederick Douglass (Silver Proof) | 496,618
2017-S Ozark Riverways (Silver Proof) | 496,618
2017-S Ellis Island (Silver Proof) | 496,618
2017-S George Rogers Clark (Silver Proof) | 496,618
2018-S Pictured Rocks (Silver Proof) | 461,048
2018-S Apostle Islands (Silver Proof) | 461,048
2018-S Voyageurs (Silver Proof) | 461,048
2018-S Cumberland Island (Silver Proof) | 461,048
2018-S Block Island (Silver Proof) | 461,048
2019-S Lowell (Silver Proof) | 539,510
2019-S American Memorial Park (Silver Proof) | 539,510
2019-S War in the Pacific (Silver Proof) | 539,510
2019-S San Antonio Missions (Silver Proof) | 539,510
2019-S Frank Church (Silver Proof) | 539,510
2020-S National Park of American Samoa (Silver Proof) | 427,191
2020-S Weir Farm National Historic Site (Silver Proof) | 427,191
2020-S Salt River Bay National Historical Park & Ecological Preserve (Silver Proof) | 427,191
2020-S Marsh-Billings-Rockefeller National Historical Park (Silver Proof) | 427,191
2020-S Tallgrass Prairie National Preserve (Silver Proof) | 427,191
2021-S Tuskegee Airmen (Silver Proof) | 490,829
American Women Quarters
(2022 - 2025)
The American Women Quarters program began in 2022 and honors notable women who made significant contributions to American history, culture, and civil rights. Each year features multiple reverse designs celebrating influential figures such as Maya Angelou, Eleanor Roosevelt, Sally Ride, and Nina Otero-Warren, among others.
The obverse continues to feature George Washington, based on a refreshed rendering of the original 1932 portrait. All circulating issues are struck in copper-nickel clad composition, with 99.9% silver proof versions produced for collectors.
This series shifts the focus of the quarter’s reverse from geography to biography, offering a modern collecting theme centered on individual achievement and representation.

-
2022-P Maya Angelou | 237,600,000
2022-D Maya Angelou | 258,000,000
2022-P Dr. Sally Ride | 275,200,000
2022-D Dr. Sally Ride | 278,000,000
2022-P Wilma Mankiller | 310,000,000
2022-D Wilma Mankiller | 296,800,000
2022-P Nina Otero-Warren | 225,000,000
2022-D Nina Otero-Warren | 219,200,000
2022-P Anna May Wong | 226,800,000
2022-D Anna May Wong | 240,800,000
2023-P Bessie Coleman | 302,000,000
2023-D Bessie Coleman | 317,200,000
2023-P Edith Kanaka’ole | 372,800,000
2023-D Edith Kanaka’ole | 368,600,000
2023-P Eleanor Roosevelt | 284,000,000
2023-D Eleanor Roosevelt | 271,800,000
2023-P Jovita Idar | 190,600,000
2023-D Jovita Idar | 188,000,000
2023-P Maria Tallchief | 850,640
2023-D Maria Tallchief | 832,240
2024-P Pauli Murray | TBD
2024-D Pauli Murray | TBD
2024-P Patsy Takemoto Mink | TBD
2024-D Patsy Takemoto Mink | TBD
2024-P Dr. Mary Edwards Walker | TBD
2024-D Dr. Mary Edwards Walker | TBD
2024-P Celia Cruz | TBD
2024-D Celia Cruz | TBD
2024-P Zitkala-Ša | TBD
2024-D Zitkala-Ša | TBD
2025-P Ida B. Wells | TBD
2025-D Ida B. Wells | TBD
2025-P Juliette Gordon Low | TBD
2025-D Juliette Gordon Low | TBD
2025-P Dr. Vera Rubin | TBD
2025-D Dr. Vera Rubin | TBD
2025-P Stacey Park Milbern | TBD
2025-D Stacey Park Milbern | TBD
2025-P Althea Gibson | TBD
2025-D Althea Gibson | TBD
-
2022-S Maya Angelou Proof | 303,520
2022-S Dr. Sally Ride Proof | 304,120
2022-S Wilma Mankiller Proof | 304,640
2022-S Nina Otero-Warren Proof | 305,560
2022-S Anna May Wong Proof | 304,680
2023-S Bessie Coleman Proof | 500,360
2023-S Edith Kanaka’ole Proof | 502,760
2023-S Eleanor Roosevelt Proof | 505,680
2023-S Jovita Idar Proof | 502,840
2023-S Maria Tallchief Proof | 498,240
2024-S Pauli Murray Proof | TBD
2024-S Patsy Takemoto Mink Proof | TBD
2024-S Dr. Mary Edwards Walker Proof | TBD
2024-S Celia Cruz Proof | TBD
2024-S Zitkala-Ša Proof | TBD
2025-S Ida B. Wells Proof | TBD
2025-S Juliette Gordon Low Proof | TBD
2025-S Dr. Vera Rubin Proof | TBD
2025-S Stacey Park Milbern Proof | TBD
2025-S Althea Gibson Proof | TBD
If You Collect U.S. 25-Cent Coins, Check Out The ‘Washington ATB Quarters, WestPoint Strikes’ Type Set!
‘Coin Collecting Tools’ is Going Mobile
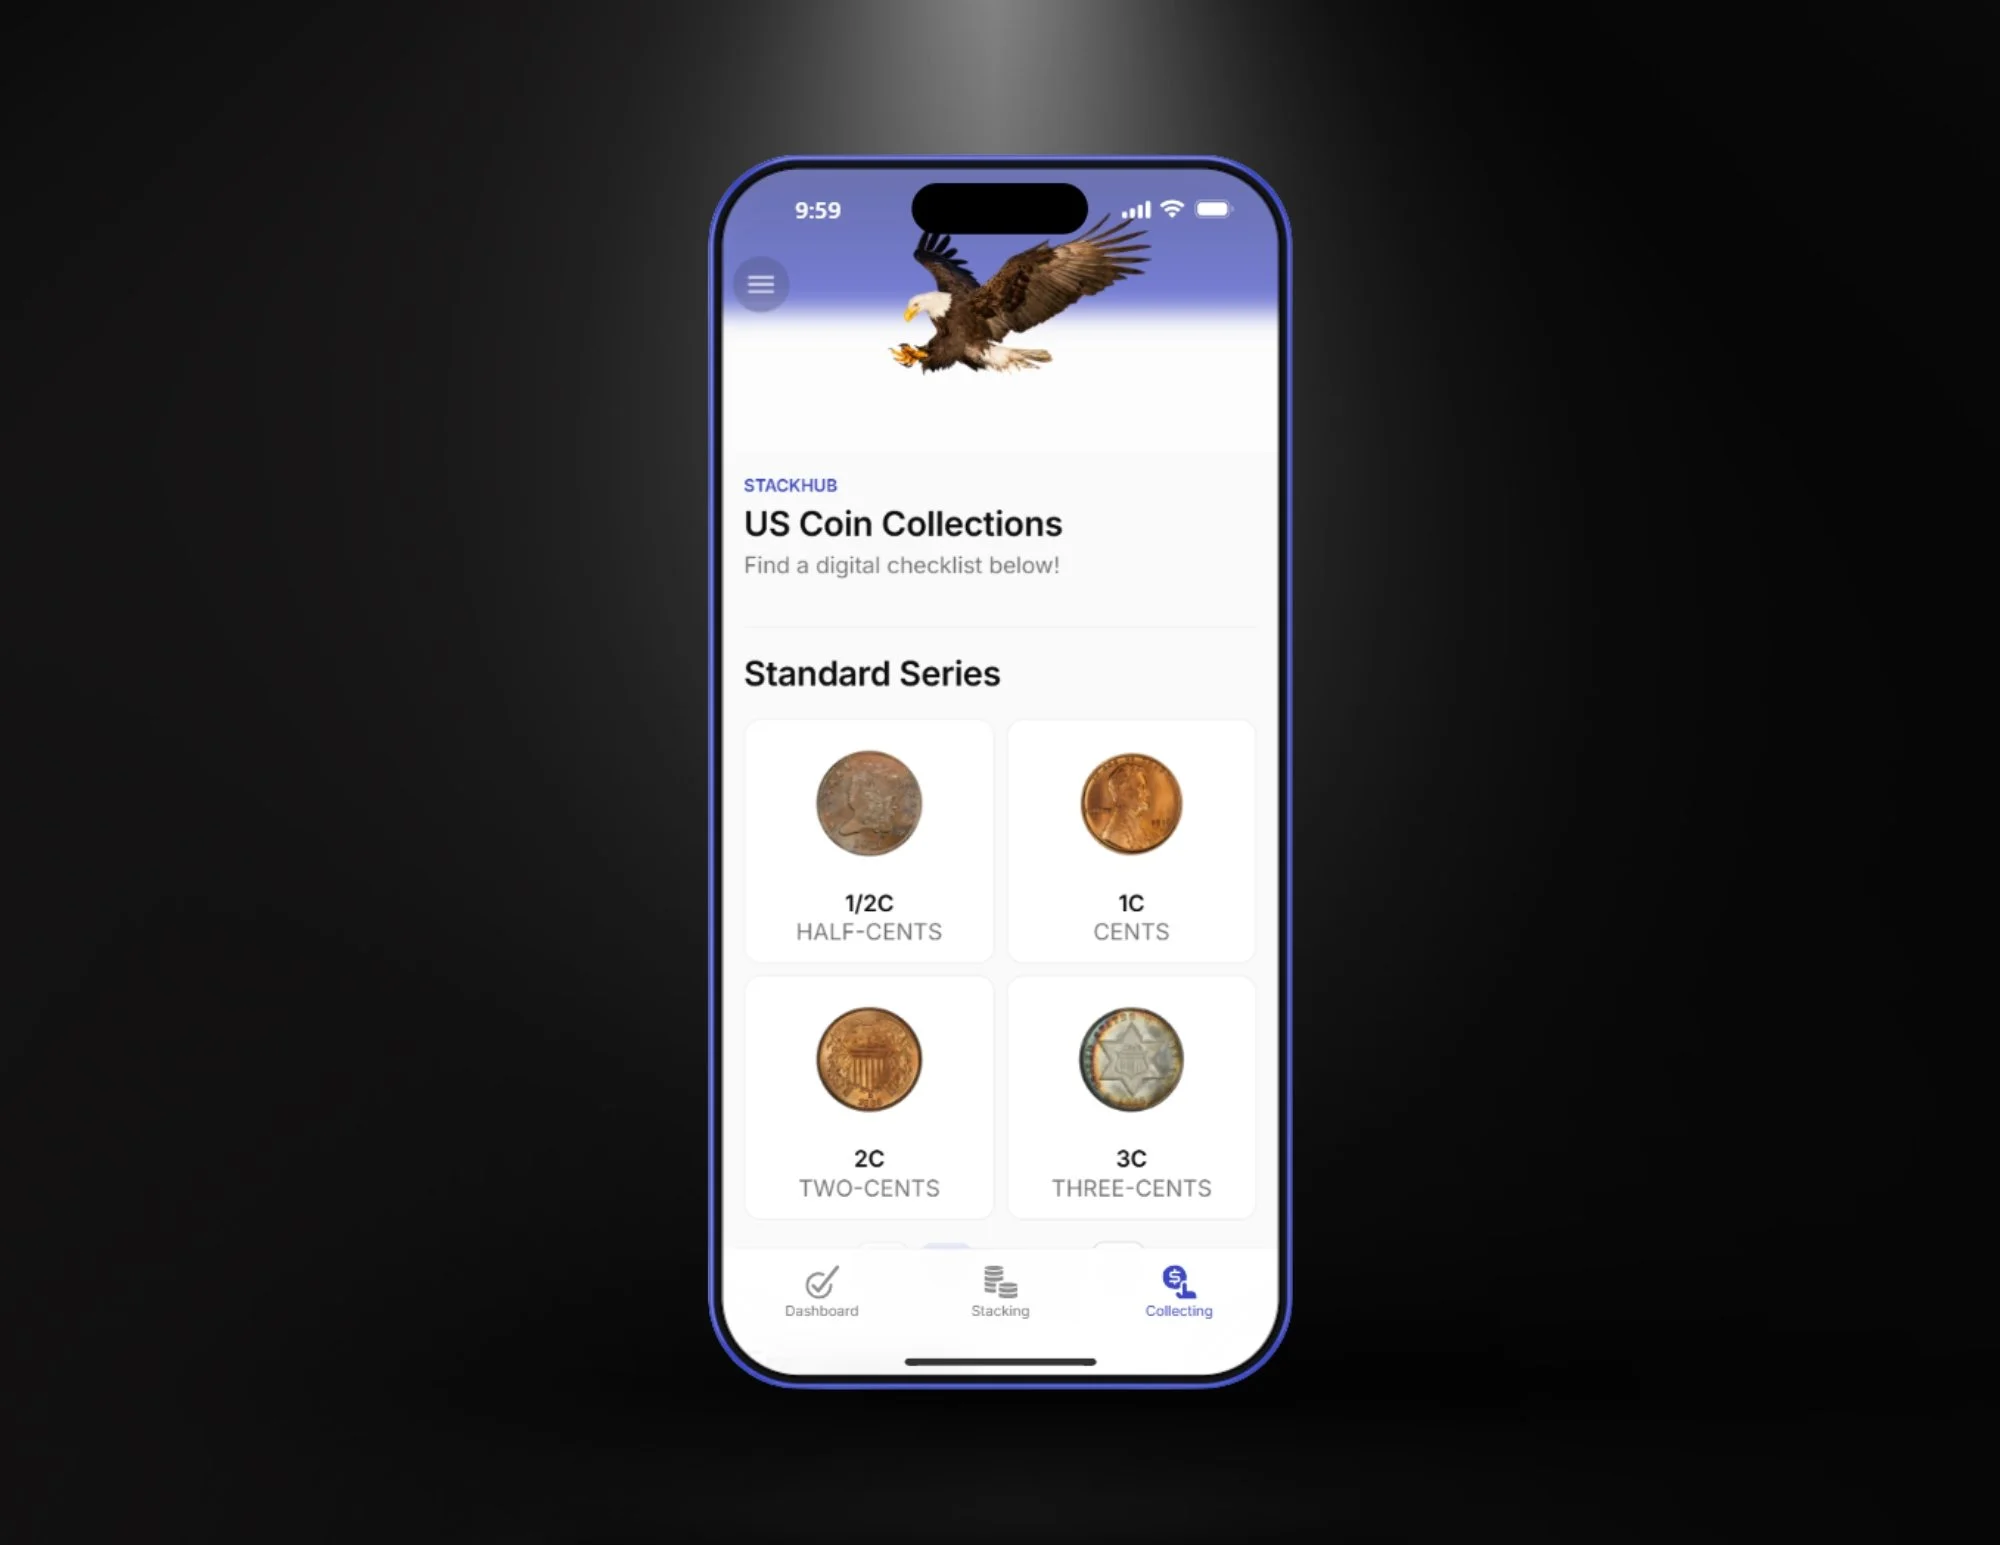
StackHub is an excellent tool for coin collectors & precious metals enthusiasts of all levels. Your app subscription will come complete with:
100+ prebuilt collection checklists to choose from
Collect graded or ungraded coins, your choice
Upload images of your own set to take on the go
Precious Metals stack tracking
Every coin collecting guide at your fingertips
Compatible with mobile & desktop
Click HERE to learn more*During checkout, please use the email address that you’d like associated with your StackHub account. You will receive an invitation to that email address directly from the platform when your account is ready. Account creation may take up to 12 hours from the time of checkout*

Check Out Our Guide to Identifying U.S. Constitutional Silver Coins
Think you might have silver coins in your pocket change? Learn the quick ways to spot United States Coinage made of silver by date, edge color, weight, and more.
Click HERE for the full guide
Why Most State Quarters Aren’t Valuable
The U.S. Mint’s State Quarters program was one of the most popular coin series ever, but despite the hype, most of these coins aren’t worth more than face value. Coin shops regularly see full sets brought in, yet unless they’re silver proofs or graded at the highest levels, dealers simply aren’t buying. Learn why State Quarters are fun to collect but rarely valuable — and what exceptions to look out for.
This site and all of its content was built by collectors for collectors. Join thousands who already trust CoinCollectingTools.com for reliable & accurate information, expert tips, and a connected community on social media. Follow us on YouTube & TikTok @CentsMakeDollars to make sure you never miss a new online resource designed to sharpen your knowledge and collecting strategies.